Global and Specific Risk
A Simplified Explanation of Each Risk Type

Global(Average) and Specific Risk
A calibration program that reports 2 % probability of false accept sounds reassuring, until you realize that number is an average across every instrument in the population. It says nothing about the measurement result sitting on your bench right now.
This is the distinction between global risk and specific risk, and confusing the two is one of the most consequential mistakes in measurement decision-making. Global risk tells you how a process performs over time. Specific risk tells you whether this particular result, at this particular point relative to the tolerance limit, is trustworthy. They answer fundamentally different questions, and treating one as a substitute for the other leads directly to conformity statements that overstate confidence.
The difference is easier to grasp than most people expect. Think of a field goal kicker in American football.
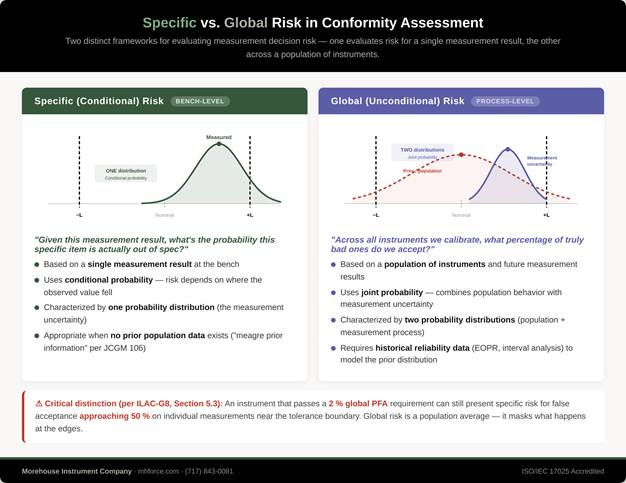
Figure 1 Specific Versus Global Risk
Global (Unconditional) Risk
Global PFA asks: “Across all the instruments we calibrate, what percentage of truly bad ones do we accept?”
This is an average across your entire population of instruments and calibration events. It depends on two things: your historical reliability data (how often do instruments actually drift out of spec?) and the uncertainty of your calibration process. You must know how your instruments behave over time to properly calculate global risk.
In programs that contractually invoke ANSI/NCSL Z540.3 [1], a common target is controlling consumer’s risk (PFA) for acceptance decisions to ≤ 2 % under the specified decision rule. This is typically framed as an unconditional, population-level requirement. Achieving that target generally requires not only a measurement uncertainty model but also a defensible model for the population of items being calibrated (i.e., historical records showing how often instruments of that type actually drift out of tolerance between calibrations), meaning prior information supported by reliability and interval data such as end-of-period reliability (EOPR) or similar historical evidence.
Where such data are limited, some Z540.3 [1] handbook approaches use managed guard banding to control reported risk under stated assumptions, at the cost of increased false rejects, without claiming full population characterization.
The catch: an instrument that passes a 2 % global PFA requirement can still present much higher specific risk on individual measurements near the tolerance boundary. The global number is an average; it masks what’s happening at the edges. ILAC-G8:09/2019 [2] makes clear that an instrument passing a global risk criterion of 2 % PFA may have a specific risk for false acceptance that can be as high as close to 50 % as shown in the previous section.
Specific (Conditional) Risk
Specific PFA asks: “Given this particular measurement result, and given my uncertainty, what’s the probability this specific instrument is actually out of spec?”
This is a conditional probability; it depends on where the observed value landed relative to the tolerance limits. A result right in the middle of the tolerance range? Very low specific PFA. A result right at the edge of the acceptance limit? The specific PFA can be substantial, even if the global number looks fine.
Specific risk is the right framework when you don’t have prior population data, what JCGM 106:2012 [3] (clause 7.2.2) calls ‘meagre prior information,’ or when a more cautious approach to false accepts is required, regardless of available data.
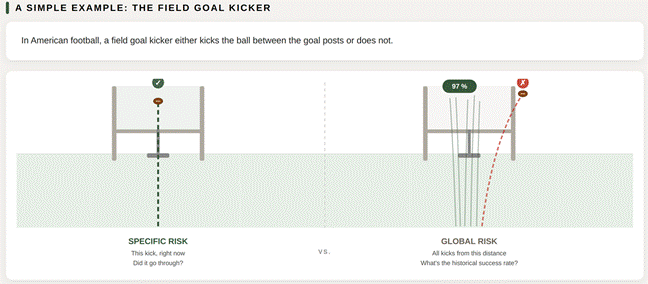
Figure 2 Field Goal Example
Specific (Conditional) Vs Global (Unconditional) Risk, A Simple Example: The Field Goal Kicker
In American football, a field goal kicker either kicks the ball between the goal posts or does not.
Specific risk is the single kick in front of you right now. The ball either traveled between the goal posts or it didn’t. Pass and points or fail and no points for your team (sorry, Ravens fans). When we make a measurement and record the observed value, it is either between the acceptance limits or it is not. One kick, one result, one decision.
Global (average) risk steps back and looks at all the kicks. Say the Steelers kicker makes 97 % of his field goals from the 35-yard line. This kick is from the 35-yard line, yet it didn’t go in. Based on population data alone, you would say it is likely that it did go in. And the Steelers won the game, hooray!
That is exactly the tension between the two approaches. Global risk uses historical population data to assess the probability of an incorrect decision, such as a false accept or false reject, across a population. Specific risk evaluates the single result in front of you. One tells you how reliable the process is over time. The other tells you what happened right now.
Now shift your focus from the kick to the goal posts themselves. The distance between them represents your tolerance. A kicker with a tight, repeatable trajectory effectively has more room to succeed because their variability is low. In contrast, a kicker with inconsistent performance needs nearly perfect alignment every time. The same principle applies to measurement: as uncertainty decreases, the “usable” portion of the tolerance increases, and confidence in the result improves.
With that perspective in mind, decision rules become the method for determining whether a result truly falls within those goal posts. Most practical decision rules stem from three foundational approaches, each offering a different way to balance risk and confidence.
If you found this breakdown useful, share it with your colleagues. The gap between global risk and specific risk is one of the most misunderstood concepts in measurement, and the consequences show up every time someone treats a 2 % population average as proof that an individual result is trustworthy. The more people in your organization who understand the difference, the better your conformity decisions become.
Share this article with anyone who writes decision rules, reviews calibration certificates, or signs off on pass/fail statements. These are the decisions that determine whether your measurements actually mean what you think they mean.
[1] ANSI/NCSL Z540.3-2006, Requirements for the Calibration of Measuring and Test Equipment. American National Standards Institute / National Conference of Standards Laboratories International.
[2] ILAC-G8:09/2019, Guidelines on Decision Rules and Statements of Conformity. International Laboratory Accreditation Cooperation.
[3] JCGM 106:2012, Evaluation of measurement data — The role of measurement uncertainty in conformity assessment. Joint Committee for Guides in Metrology.